
Past Bookings Statistics (Historical Booking Analytics)
The Past Bookings Statistics report helps you analyze historical booking performance across a selected time period. It shows booking volume (count) and booking value (sum), broken down by booking status, so you can identify trends, seasonality, conversion bottlenecks, and operational issues.
What counts as “Past Bookings”? This report is designed to reflect bookings that fall within your selected historical date range (typically based on the booking’s scheduled date/time in the past). Use the date filter to control exactly what time period is included.
This is ideal for performance reviews, capacity planning, seasonality analysis, and tracking revenue realized compared to invoices and payments.
On this page
- How to access Past Bookings Statistics
- What this report helps you do
- Choose date range & time grouping (weekly/monthly/quarterly/yearly)
- Use the Past Booking Summary Chart
- Chart modes explained (Total, Count, Paid, All Invoices)
- Filter & compare by booking status
- Understand the breakdown table (count & sum)
- View past bookings by status (quick steps)
- View company sales summary chart (quick steps)
- My dashboard vs All dashboard
- Common use cases & examples
- Best practices & troubleshooting
- Related guides
How to access Past Bookings Statistics
- Log in to your OctopusPro Admin Portal.
- From the left menu, go to Statistics > Past Bookings (in some layouts, this may appear under your Dashboard section).
Permission note: Access depends on your role (RBAC). If you can’t see this page, ask an admin to enable the relevant statistics/reporting permissions.
What this report helps you do
- Historical overview: review past bookings by count and sum to understand workload and revenue patterns.
- Flexible analysis periods: switch between weekly, monthly, quarterly, and yearly groupings.
- Status insights: compare performance across booking statuses (e.g., In Progress, Quoted, Cancelled, Failed).
- Trend identification: spot peaks, dips, and seasonality to improve planning and forecasting.
- Operational improvement: detect issues (e.g., rising cancellations, too many “On Hold” bookings) and refine your workflow.
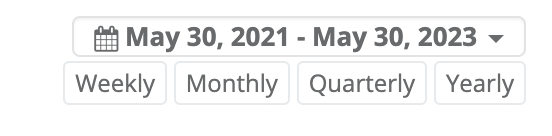
Choose date range & time grouping (weekly/monthly/quarterly/yearly)
Use the date range selector to choose the period you want to analyze, then switch the grouping to Weekly, Monthly, Quarterly, or Yearly to match the level of detail you need.
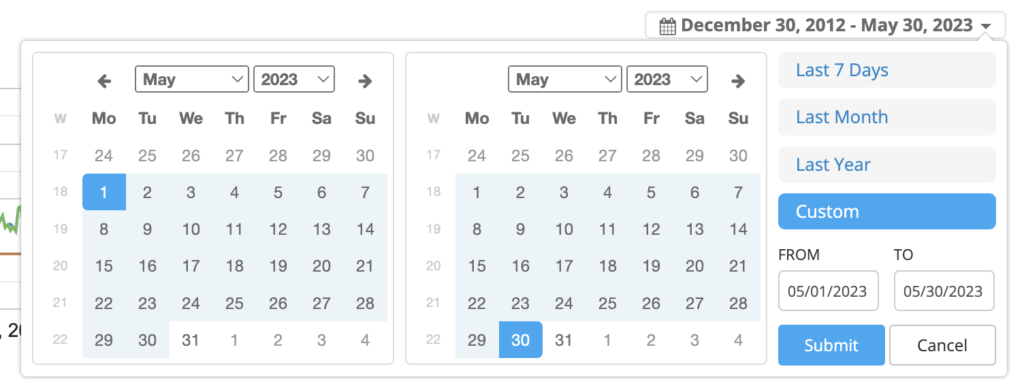
Click the date range to open the calendar picker. You can use quick presets (e.g., last 7 days, last month, last year) or set a custom range.
Tip: For business reviews, use Quarterly or Yearly. For staffing/dispatch decisions, use Weekly or Monthly.
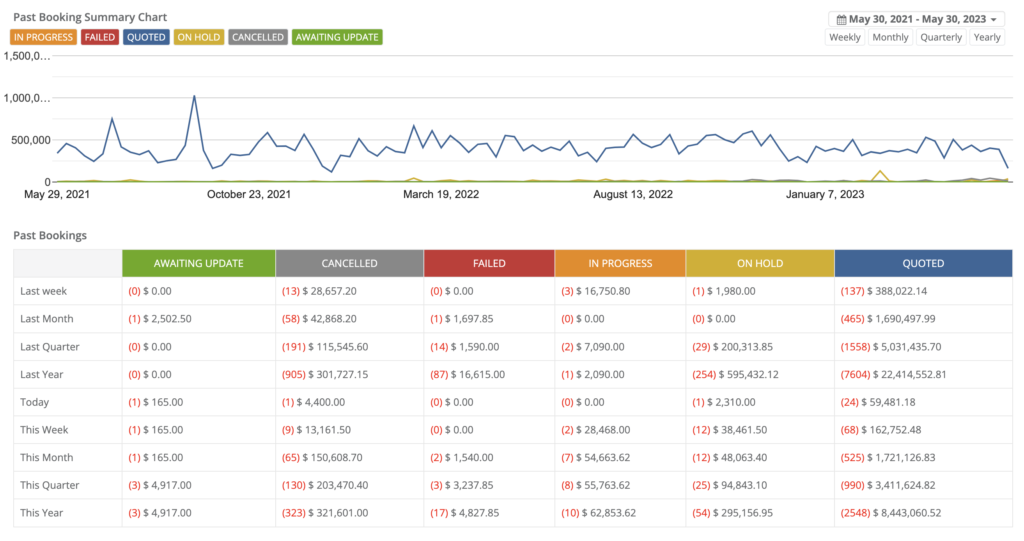
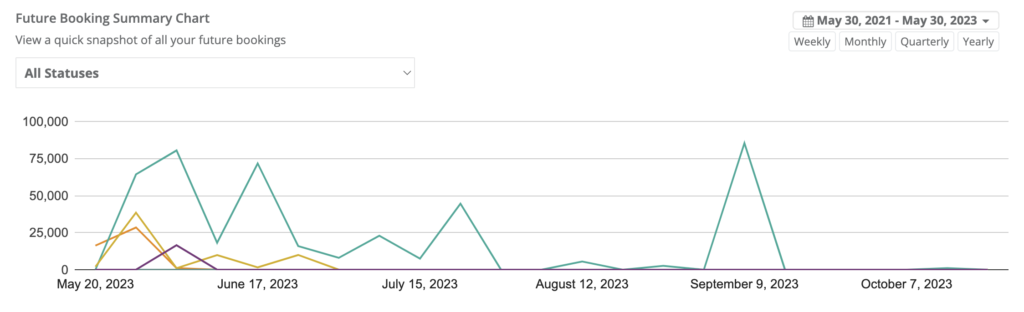
Use the Past Booking Summary Chart
At the top of the page, the Past Booking Summary Chart visualizes booking performance over time. Each line typically represents a booking status (your statuses may vary by account).
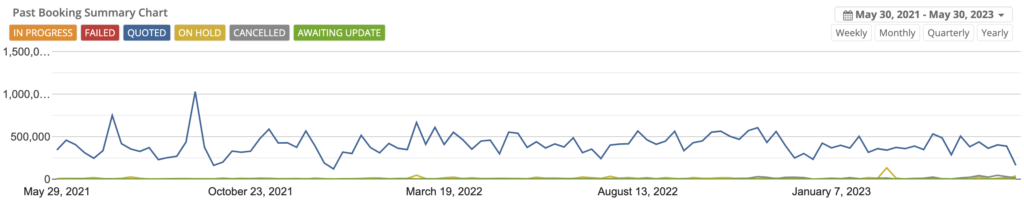
Hover over any point on the chart to view exact values for that time bucket.
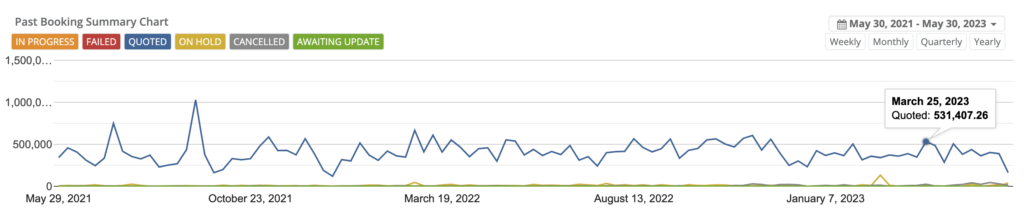
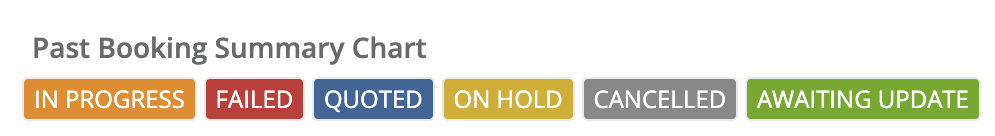
Chart modes explained (Total, Count, Paid, All Invoices)
Use the icons on the right of the chart to switch what is being measured (available options may vary by setup):
- Total: shows the total booking value (sum) over time.
- Count: shows the number of bookings over time.
- Paid: shows paid amounts based on recorded payments.
- All Invoices: shows invoiced totals linked to those bookings.
Note: Invoice and payment-based views depend on invoices being created/linked and payments being recorded against them.
Filter & compare by booking status
You can compare performance across booking statuses. Each status typically appears as a selectable label and as a line on the chart.
Important: Booking statuses can be customized. If you need to add/edit statuses or standardize your workflow, see Managing Booking Statuses.

Understand the breakdown table (count & sum)
Scroll down to the table to view a detailed breakdown by time period and status. This view is perfect for quick comparisons such as “Last Month vs This Month” or “Last Year vs This Year.”
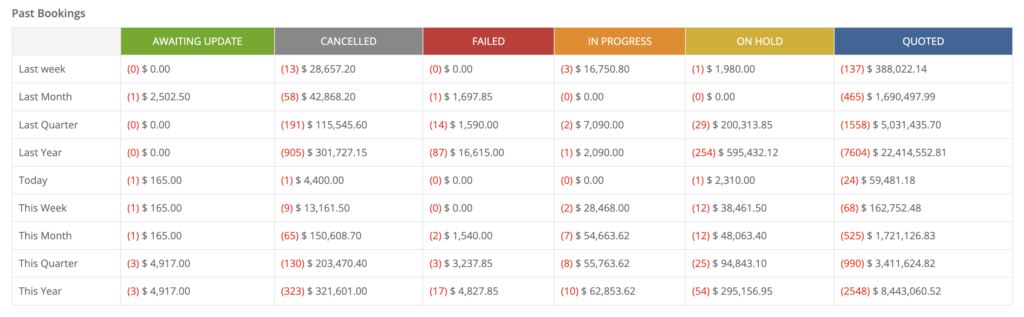
How to read the values
- Count is typically shown in brackets ( ).
- Sum is the monetary total shown alongside the count (in your account currency).
- Rows commonly include ranges such as Last Week, Last Month, Last Quarter, Last Year, and current ranges like This Week, This Month, This Quarter, This Year.
Need record-level detail? Use Booking History & Audit Log and Booking Activity to review changes, actions, and timelines.


View past bookings by status (quick steps)
To view the table of past bookings classified by booking status and time period:
- Go to Statistics > Past Bookings.
- Scroll down to the Past Bookings table.
- Review the count and sum by status across the available time ranges.
View company sales summary chart (quick steps)
The chart at the top of the page provides a quick visual snapshot of booking performance for your selected period.
- Go to Statistics > Past Bookings.
- Review the Past Booking Summary Chart at the top.
- Use the chart icons to switch between Total, Count, Paid, and All Invoices.
- Hover over any point to view the exact value for that time bucket.
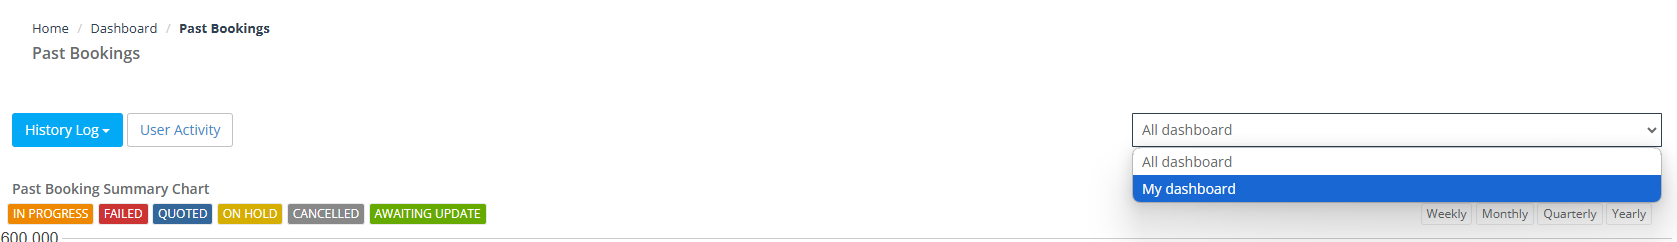
My dashboard vs All dashboard
You can switch the data scope depending on your role and what you need to measure:
- My dashboard – shows only bookings attributed to you (personal performance view).
- All dashboard – shows bookings across the entire company (business-wide view).
View your personal dashboard
- Go to Statistics > Past Bookings.
- Use the scope selector (top-right) and choose My dashboard.
View the company-wide dashboard
- Go to Statistics > Past Bookings.
- Use the scope selector (top-right) and choose All dashboard.

Note: If you don’t see All dashboard, your role may be restricted to personal reporting only.
Common use cases & examples
- Seasonality planning: Identify peak months and prepare staffing, inventory, and scheduling capacity.
- Cancellation reduction: If “Cancelled” rises, improve confirmations, deposits, reminders, or rescheduling workflows.
- Conversion improvement: If “Quoted” is high but “In Progress/Completed” is low, strengthen follow-ups and availability.
- Revenue reviews: Compare Total vs All Invoices vs Paid to understand billing and collection performance.
- Operational health: Track “On Hold” or “Awaiting Update” volume to reduce stalled jobs.
Example: A spike in “Failed” or “Cancelled” bookings during a specific month may indicate staffing shortages, coverage gaps, pricing issues, or a process breakdown (e.g., poor confirmation or scheduling conflicts).
Best practices & troubleshooting
Best practices
- Use consistent grouping when comparing periods (e.g., quarter-to-quarter).
- Review status health weekly to catch operational issues early.
- Use Live Reports for deeper analysis when you need filters, exports, or more dimensions.
Troubleshooting
- “Paid/Invoices don’t match what I expect”: these views depend on invoices being created and payments being recorded.
- “I can’t see this page”: ask an admin to enable reporting/statistics permissions for your role.
- “My statuses are different”: booking statuses are configurable; review your workflow settings.
For advanced reporting and exporting, see Live Reports & Analytics.

Related guides
- Dashboard Summary (KPIs & Performance Overview)
- Future Bookings Statistics
- Completed Bookings Statistics
- Inquiries Statistics Dashboard
- Create a New Booking
- Managing Booking Statuses
- Booking History & Audit Log
- Booking Activity
- Live Reports & Analytics
Note: The reporting controls (date range, weekly/monthly/quarterly/yearly grouping, and chart modes) are consistent across the Booking Statistics pages.
To stay updated, please subscribe to our YouTube channel.