
Running Live Reports – Your Data, Anytime
OctopusPro comes with a built-in Business-Intelligence layer. Every booking, payment, checklist and timesheet is written to an analytics warehouse that powers Live Reports—interactive grids you can slice, dice and export in seconds.
Navigating to Reports
Left Menu → Reports
A tree menu expands into six report families:
| Folder | What you’ll find | Key use-cases |
| All Booking Reports | Volume, conversion, service mix, custom-field summaries. | Revenue forecasting, product-line ROI. |
| Technicians Reports | Timesheets, attendance, payment summaries.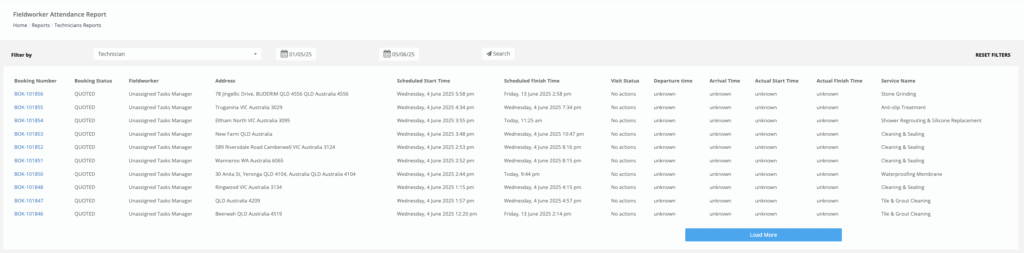 |
Payroll, utilisation, incentive schemes. |
| Payment Reports | Cash received, technician pay-outs, invoices, refunds. 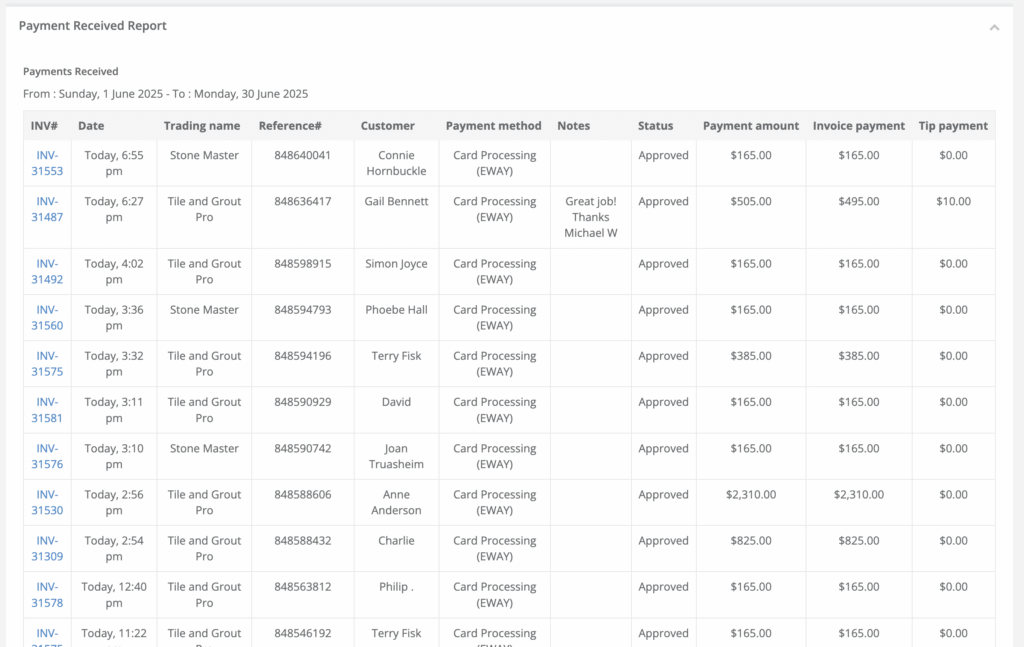 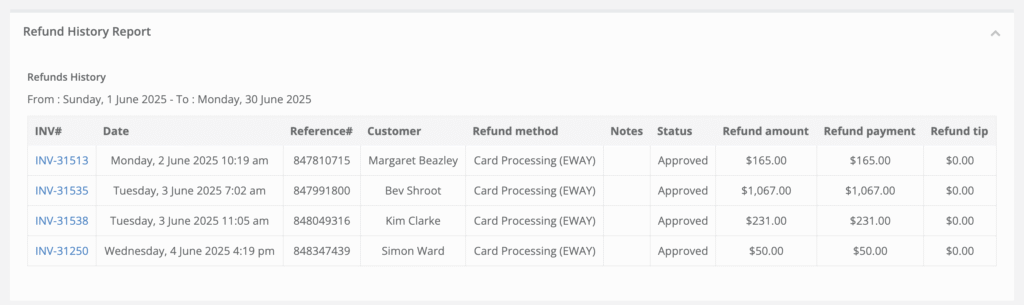 |
Cash-flow, debt collection, reconciliation. |
| Employee Reports | Sales by employee (office staff or franchise). | Commission & performance reviews. |
| History Log | Automations, calls, emails, SMS, issues, discussions. | Compliance & troubleshooting. |
| User Activity Log | Login times, screen actions. | Security auditing, labour costing. |
Saved filters appear under Saved Reports for one-click re-runs.
Running and Exporting a Report
| Step | Action | Pro-tip |
| 1. Select report | Click a title (e.g. Booking Summary By Service / Custom Field). | Reports load in a new tab so you can bounce between dashboards. |
| 2. Apply filters | Date pickers, dropdowns, multiselect labels. | Dropdowns support search; start typing pla to find “Plastering”. |
| 3. Click Search | Grid refreshes instantly—no page reloads. | Most reports run < 2 s thanks to indexed warehouse tables. |
| 4. Review totals & subtotals | Many reports show a running total row at the bottom. | Hover column header for sort & aggregate options. |
| 5. Export | Export as (xls) button downloads native Excel. | CSV available via ⋮ menu (permissions-based). |
| 6. Save preset (optional) | Click Save Report (if role allows) → give it a name. | Appears under Saved Reports for quick access. |
Report Examples & Business Benefits
| Report | Filters | Insight delivered |
| Convert to Booking Duration | Booking status = Completed; Date range = last 6 m. | Average lead time from inquiry to confirmed job—pinpoints sales bottlenecks. |
| Forms & Checklists Summary | Form name = Job Completion Form; Tech label = New Hire. | QA team audits workmanship of new recruits. |
| Feedback Summary | Feedback status = Negative; Technician = All; Date range = month-to-date. | CS manager priorities callbacks, tracks NPS. |
| Technicians Timesheet | Label = Subcontractor; Period = last pay cycle. | Export to payroll provider in one click. |
| Payment Received | Payment method = Credit-card; Date range = quarter-to-date. | Reconcile Stripe account vs bank deposits. |
Best-Practice Tips
- Use labels to build ad-hoc cohorts—e.g. tag VIP clients, new services or marketing sources.
- Schedule exports with a Zapier/Zap or API script to push XLS/CSV to Google Drive daily.
- Leverage column sorting and drag-&-drop re-ordering before exporting—Excel retains your layout.
- Keep date ranges tight for snappier performance; archive historic data to Saved Reports.
- Combine reports—e.g. run Technicians Attendance then drill further with Technicians Detailed Summary to see revenue per hour.
Frequently Asked Questions
| Question | Answer |
| Do reports update in real time? | Yes—data writes instantly on each booking or payment save; refresh the report to pull new rows. |
| Can I limit who sees what? | Report access follows role permissions. E.g., contractors may view only their own timesheet. |
| Can I share a live link? | Use Saved Reports + Share toggle to generate a link visible to logged-in users with permission. |
| How big can exports be? | Up to 50 k rows per file. Split by month for larger datasets. |
Key Takeaways
- Full-funnel visibility from inquiry through payroll in one menu.
- Filter, sort, export—no SQL required.
- Saved presets & role-based access keep the right data in the right hands.
Open Reports → All Booking Reports → Booking Summary now and turn raw data into decisions—live.
To stay updated, please subscribe to our YouTube channel.