
Dashboard Summary (Admin Dashboard Overview)
The OctopusPro Dashboard is your admin control centre for monitoring business performance and taking quick action. It gives you a real-time snapshot of your sales pipeline (inquiries and estimates), workload (upcoming bookings), completed revenue, and service quality (open complaints), plus communication widgets like SMS and internal discussions.
Use the dashboard to: stay on top of new leads, track quoting and conversion, plan capacity for upcoming jobs, monitor performance trends, and respond faster to customers and internal updates.
On this page
- How to access the dashboard
- Dashboard sections at a glance
- KPI tiles (Inquiries, Estimates, Completed, Complaints)
- Action widgets (Inquiries, Upcoming Jobs, SMS, Discussions)
- Performance charts (Future, Completed, Past, Pipeline)
- Flexible timeframes (Daily, Weekly, Monthly, Quarterly, Yearly)
- Recommended daily workflow
- Definitions & best practices
- Troubleshooting
- Related guides
How to access the dashboard
- Log in to your OctopusPro Admin Portal.
- Open Dashboard (usually the first screen after login).
- If available, use the dashboard scope selector (e.g., All dashboard vs personal view) to switch between company-wide insights and your own activity.
Note: Dashboard visibility can depend on your role permissions. If you can’t see specific widgets, ask an admin to review your access.
Dashboard sections at a glance
The dashboard combines KPIs, actionable lists, and trend charts. This helps you monitor performance while also taking immediate action (follow up, schedule, reply, assign, or resolve issues).
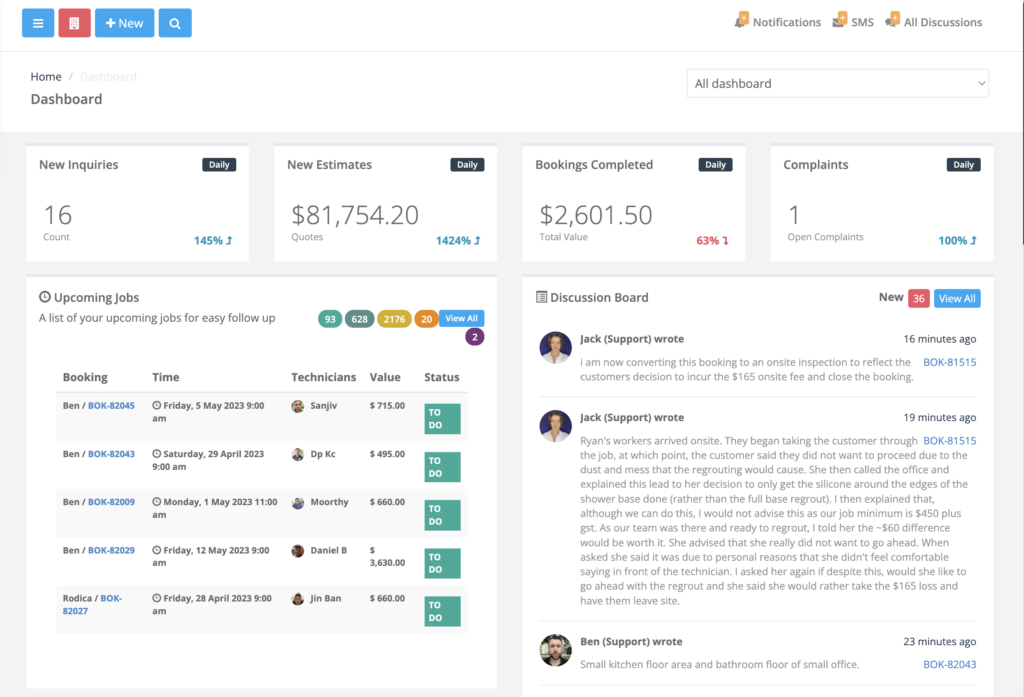
Dashboard example showing KPI tiles, Upcoming Jobs, and the Discussion Board.
KPI tiles (Inquiries, Estimates, Completed, Complaints)
At the top of the dashboard, KPI tiles give you a quick performance snapshot for a selected time period. These KPIs typically include:
- New Inquiries – number of new leads received.
- New Estimates – total value of quotes/estimates created (pipeline value).
- Bookings Completed – value of completed work (realised revenue).
- Complaints – open customer issues that need action.
Many KPI tiles also show a percentage change compared to the previous matching period (helpful for spotting increases or declines at a glance).
Drill-down tip: If your dashboard allows it, click a KPI tile (or related “View all” button) to open the relevant list filtered to the same period.
Action widgets (Inquiries, Upcoming Jobs, SMS, Discussions)
Under the KPIs, the dashboard may display operational widgets designed for quick action:
- Inquiries – view incoming leads and ensure they’re being followed up.
- Upcoming Jobs – review scheduled bookings and confirm assignment/capacity.
- SMS Messages – see new inbound messages and reply quickly.
- Discussion Board – internal notes and collaboration updates tied to jobs and records.
Best practice: Treat these widgets like your daily “operations inbox”. Aim to clear new items every day to keep response times fast and jobs on track.
For deeper communication monitoring and logs, see:
- Notifications, Discussions, Call & SMS Alerts
- SMS History Log & Notifications
- Customer Communication History (Email & SMS Log)


Performance charts (Future, Completed, Past, Pipeline)
Charts help you track both upcoming workload and historical performance. Depending on your setup, you may see:
- Future booking summary – forecast workload and expected revenue over time.
- Completed bookings – track realised revenue and completion trends.
- Past bookings – analyse historical outcomes (e.g., completed, cancelled, failed, on-hold).
- Inquiries pipeline – compare inquiries vs estimates vs bookings to understand conversion trends.
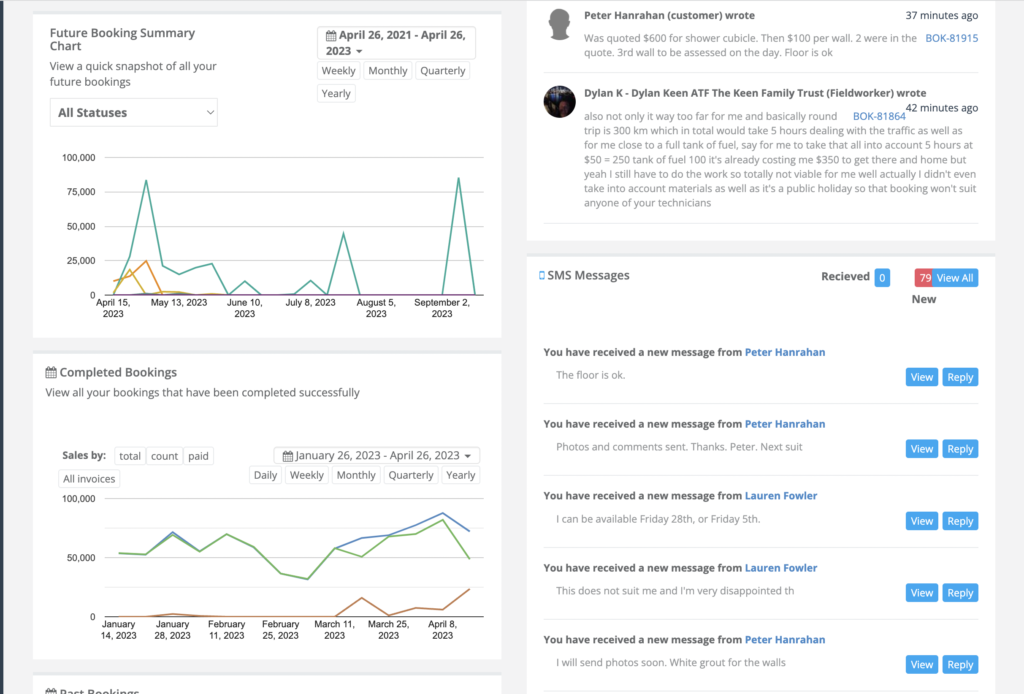
Future Booking Summary and Completed Bookings charts, alongside SMS Messages.
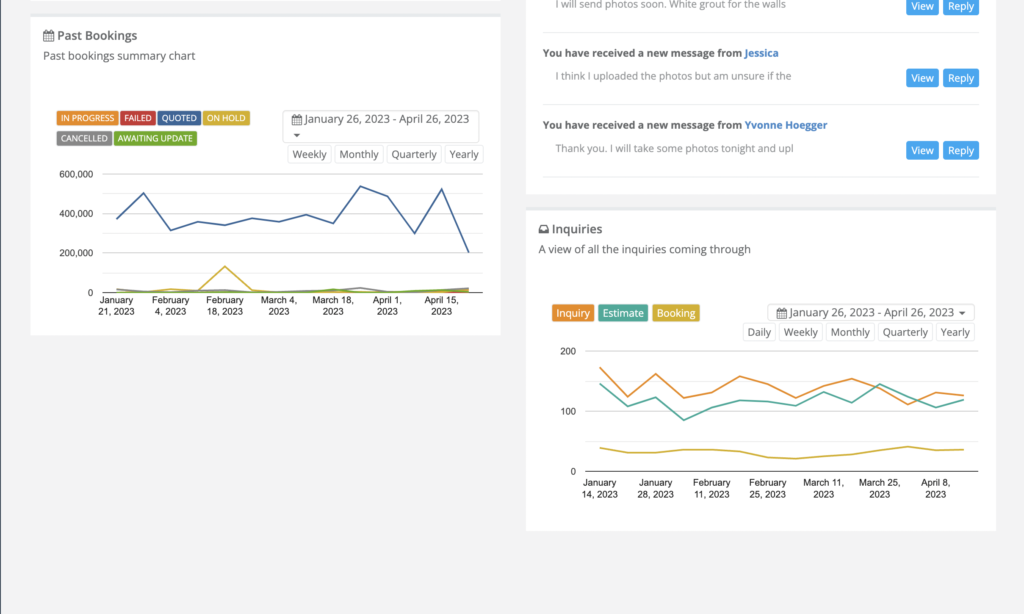
Past Bookings summary and Inquiries pipeline trends.
How to interpret pipeline trends:
- If Inquiries are stable but Estimates drop, your quoting/follow-up may be delayed.
- If Estimates rise but Bookings don’t, review acceptance and conversion (pricing, response time, availability).
- If Past bookings show high cancellations/failures, review scheduling rules, service areas, and customer communication.
Flexible timeframes (Daily, Weekly, Monthly, Quarterly, Yearly)
The dashboard lets you switch timeframes to match how you track performance—daily operations, weekly planning, monthly reporting, or quarterly and annual reviews.
Examples of KPI views by timeframe:
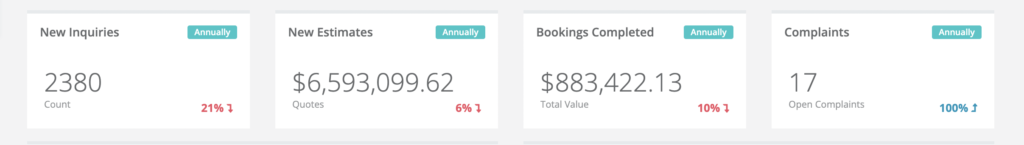
KPI tiles in an annual view.
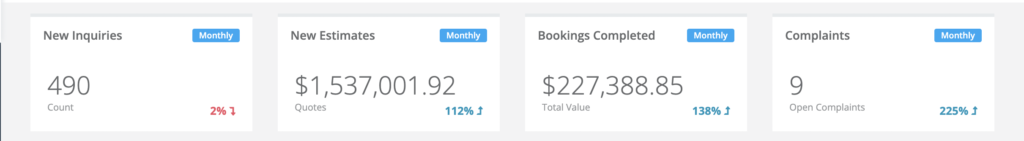
KPI tiles in a monthly view.
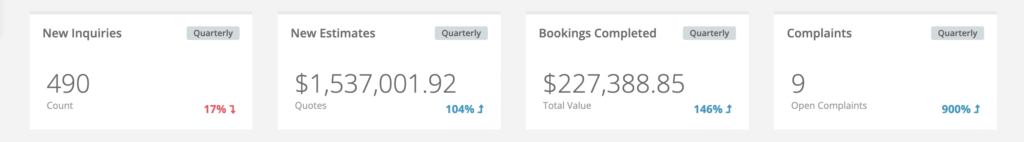
KPI tiles in a quarterly view.
Tip: When comparing performance, keep the same timeframe (e.g., monthly vs monthly) for a like-for-like comparison.
Recommended daily workflow
Here’s a simple dashboard routine that works well for most service businesses:
- Check KPI tiles to understand lead volume, quoting activity, completed revenue, and open complaints.
- Review Upcoming Jobs to confirm assignments, timing, and capacity for the day/week ahead.
- Open new Inquiries and ensure follow-ups are scheduled and quotes are issued quickly.
- Reply to new SMS and resolve urgent customer questions before they impact bookings.
- Scan internal Discussions for team updates, job notes, and pending decisions.
- Resolve complaints early to protect customer satisfaction and reduce escalations/refunds.
Definitions & best practices
- Inquiries are leads (new requests) that may become quotes or bookings.
- Estimates represent pipeline value (potential revenue).
- Completed bookings represent realised revenue (actual work delivered).
- Complaints should be triaged quickly—unresolved issues can cause churn, refunds, and negative reviews.
- Use charts weekly: Review trends weekly/monthly to adjust staffing, availability, and follow-up processes.
For deeper analytics (advanced filters, exports, and detailed reporting), see:

Troubleshooting
- Dashboard numbers look incorrect: confirm your selected date range and timeframe (daily/weekly/monthly/etc.).
- Missing widgets or charts: your role may not have access. Ask an admin to review permissions.
- Low conversion (estimates → bookings): review response time, quote follow-ups, service availability, and pricing.
- High cancellations/failures: review scheduling, confirmation reminders, service areas, and communication processes.
Related guides
- Inquiries & Lead Management
- Inquiries Statistics
- Future Bookings Statistics
- Past Bookings Statistics
- Completed Bookings Statistics
- Booking Management General Overview
- Create a New Booking
- Calendar Overview
- Issues & Complaints Log
- Discussions History Log
- User Activity Log
- Outbound Email Log
- Call History Log
To stay updated, please subscribe to our YouTube channel.