
Inquiries Statistics Dashboard: Monitor Lead Sources, Growth and Conversion Rate
The Inquiries Dashboard in OctopusPro allows admin users to monitor, track, analyze, and take action effectively and in real-time. This powerful dashboard provides real-time insights into customer inquiries, bookings, and services. Situated under the Statistics menu, the Inquiries Dashboard is a rich resource for boosting conversion rates, enhancing customer service, and driving business growth. This guide will walk you through each functionality, showcasing the array of benefits that this feature offers.
Benefiting from the Inquiries Statistics Dashboard:
- Real-time Monitoring: Track customer inquiries and bookings as they happen, enabling swift response and improved customer service.
- Conversion Rate Tracking: Monitor your booking conversion rates to understand how effectively inquiries are turning into confirmed bookings.
- Lead Source Analysis: Analyze lead sources to optimize marketing efforts and identify high-performing channels.
- Service Performance Metrics: Get a detailed breakdown of accepted, declined, and pending services to better understand your service performance.
- Trend Identification: Identify inquiry and booking trends to forecast demand and align resources accordingly.
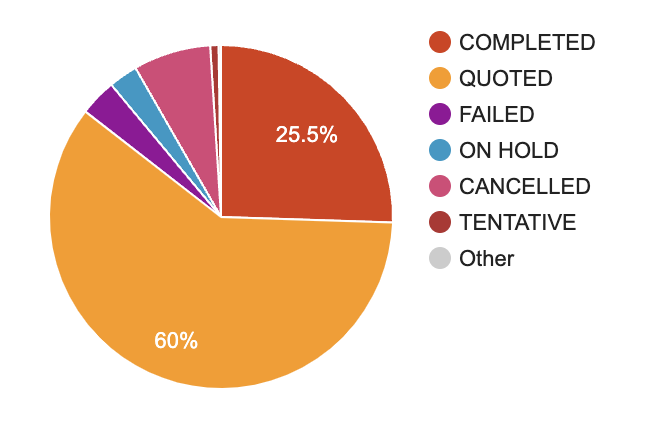
- Booking Status Overview: Keep tabs on booking statuses (in progress, completed, quoted, etc.) to spot potential bottlenecks and improve processes.
- Customizable Views: Tailor your dashboard view to your preferences for a more efficient and personalized user experience.
- Data-Driven Decision Making: Leverage real-time data and trends to make informed strategic decisions and boost your organization’s performance.
Accessing The Dashboard
- Navigate to the Statistics menu.
- Select Inquiries.
Upon selection, you will be greeted by an array of data relating to customer inquiries, bookings, and service metrics.
Interpreting Inquiry Data
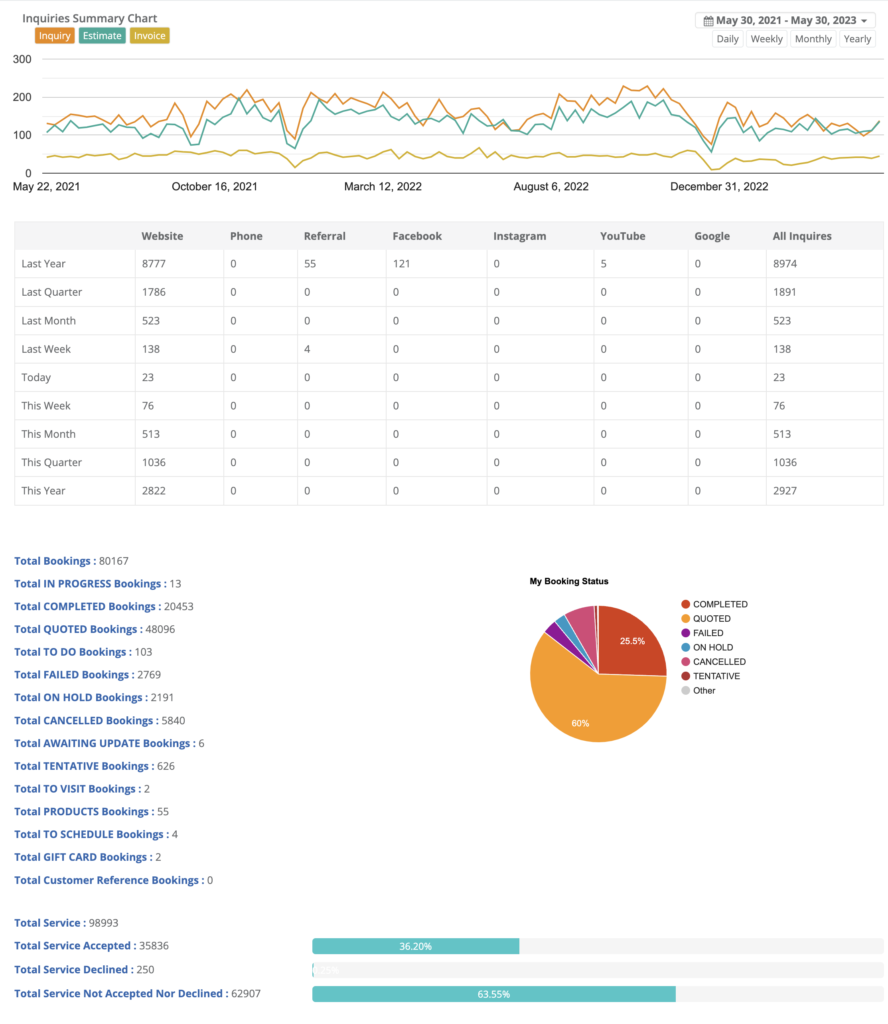
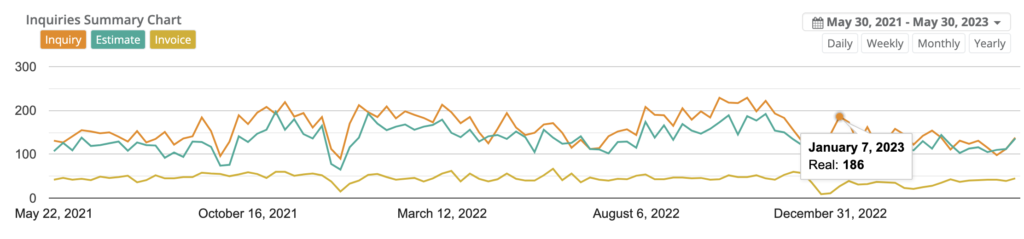
At the top of the page, you will find a comprehensive chart illustrating all customer inquiries. This chart serves as a visual aid for discerning patterns and trends over time and can be adjusted to display daily, weekly, monthly, or yearly data.
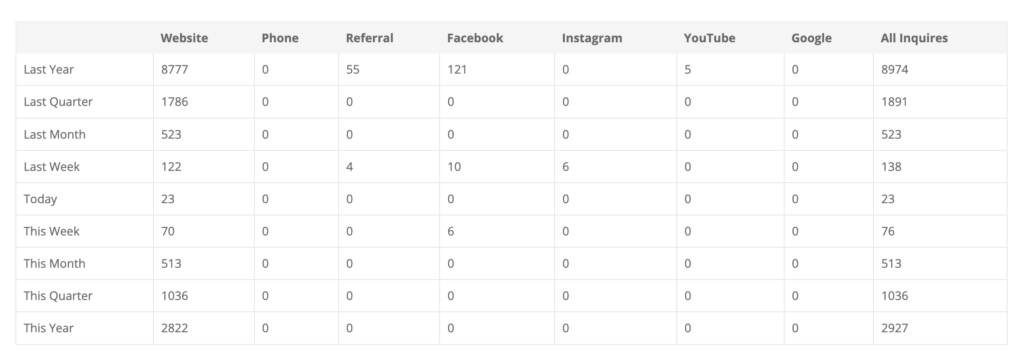
Further down, a detailed breakdown of inquiries is presented, categorizing them by their origin, such as through the website or via telephone, and the time they were made. A table located below the chart further dissects the inquiries by their source and period.
Track Leads by Source
The Inquiries Dashboard provides flexibility in terms of how you prefer to view your data. Under the General Settings, you can adjust your inquiry source options or even choose to hide this field entirely if tracking lead sources is not a priority for your organization. To learn more, visit our guide on how to track lead sources.
In-Depth Inquiry Metrics
Analyzing Booking Statistics
The dashboard hosts an exhaustive array of booking statistics, providing a bird’s eye view of your organization’s performance. Each booking status is meticulously recorded, and is accompanied by a tally, enabling you to quickly grasp the distribution of your bookings and identify any potential bottlenecks or areas of improvement.
Service Accept / Decline Statistics
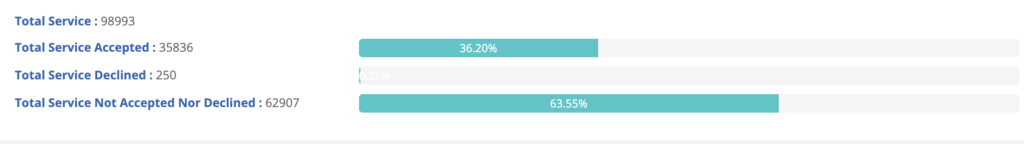
Beyond bookings, the dashboard delivers crucial metrics related to the services you offer. These include:
- Total Service
- Total Service Accepted
- Total Service Declined
- Total Service Not Accepted Nor Declined
The Inquiries Dashboard, found within the Statistics menu, is a powerful tool that offers admin users comprehensive insights into customer inquiries and service performance. With real-time tracking, trend analysis, and customizable views, it’s your reliable assistant for improving organizational performance. Use this guide to navigate the dashboard effectively, unlocking its full potential to elevate your customer service and booking rates.
To stay updated, please subscribe to our YouTube channel.