
Inquiries Statistics Dashboard
The Inquiries Statistics Dashboard gives you a real-time overview of your lead pipeline—from incoming customer inquiries to quotes/estimates and confirmed bookings. Use it to measure lead volume, compare lead sources, monitor conversion trends, and track booking and service outcomes so you can improve follow-up, reduce bottlenecks, and grow revenue.
In this guide
- Access the dashboard
- What you can track (KPIs & insights)
- Inquiries Summary Chart (Inquiry / Estimate / Invoice)
- Interpreting inquiry data
- Track leads by source
- In-depth booking metrics (conversion)
- Service accept/decline metrics
- Practical examples (how to act on the data)
- Best practices
- Troubleshooting
- Related guides
Access the dashboard
- From the left menu, go to Statistics.
- Select Inquiries.
You’ll see charts and tables summarizing inquiry volume, lead sources, booking outcomes, and service performance.
Note: Some accounts may include a scope selector (for example, My Dashboard vs All Dashboard) depending on your permissions and reporting configuration.
What you can track (KPIs & insights)
This dashboard helps you answer questions like:
- How many inquiries are we receiving? (trend over time)
- Where do leads come from? (website, phone, referrals, social, etc.)
- How are bookings performing? (status distribution and conversion health)
- Are assigned services being accepted quickly? (accepted vs declined vs pending)
Use these insights to tighten lead qualification, improve follow-up speed, optimize marketing spend, and plan staffing capacity.
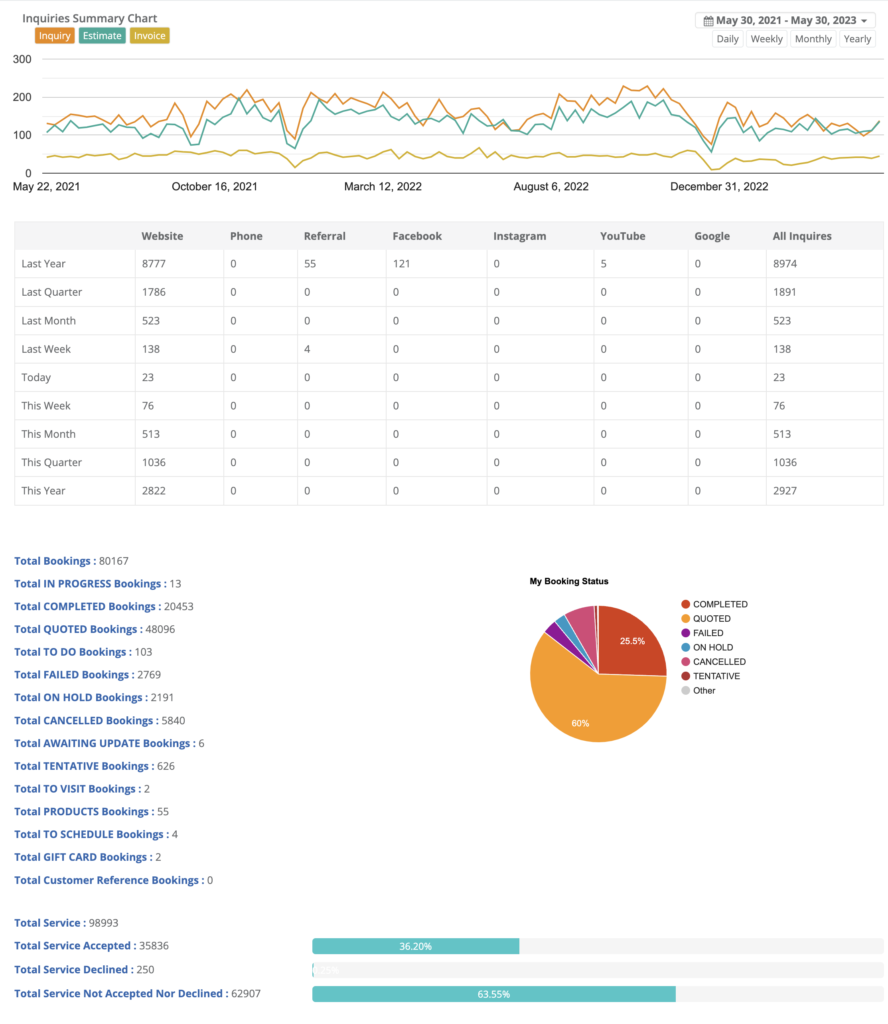
Inquiries Summary Chart (Inquiry / Estimate / Invoice)
At the top of the dashboard is the Inquiries Summary Chart. It provides a trend line view across your pipeline and supports multiple views such as Inquiry, Estimate, and Invoice (depending on your configuration).
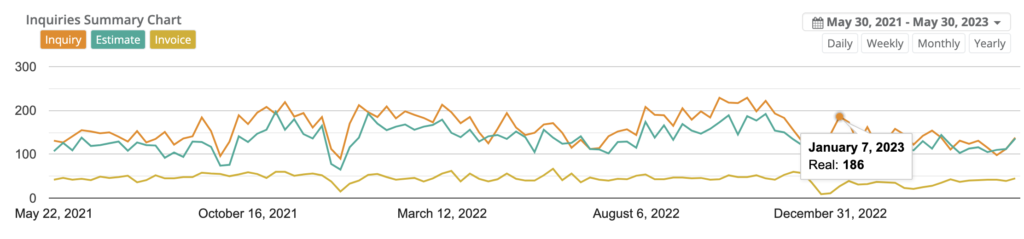
How to use the chart
- Switch the metric: Use the tabs (e.g., Inquiry / Estimate / Invoice) to change what you’re measuring.
- Filter by date range: Use the date range selector to focus on a specific period.
- Change the grouping: Toggle Daily, Weekly, Monthly, or Yearly to spot trends more clearly.
- Hover for exact values: Hover over points to view counts for each period.
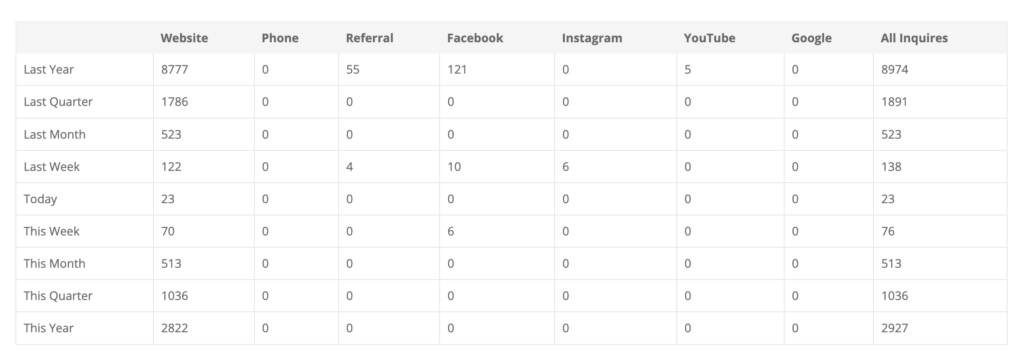
Interpreting inquiry data
Below the chart, you’ll typically see a breakdown that helps you understand how many inquiries were created, when they were created, and how they’re distributed by source. This makes it easy to compare performance across time periods like Today, This Week, This Month, This Quarter, and This Year.
Track leads by source
The dashboard includes an Inquiries by Source table that shows how many inquiries came from each channel (for example: Website, Phone, Referral, Facebook, Instagram, YouTube, Google) over different time periods.
Improve attribution accuracy
- Train staff to always select the correct Inquiry Source when creating an inquiry.
- Keep lead source names consistent (e.g., “Google Ads” vs “Google” vs “Ads”) so reports stay meaningful.
Manage lead source options
You can configure lead source options from your settings (and enable/disable lead source visibility for admin users):
- Go to Settings > General Settings > Lead Sources.
- Add, rename, or remove sources to match your marketing channels.
Learn more here: Track and Manage Lead Sources.
![]()
In-depth booking metrics (conversion)
The dashboard provides booking statistics and a breakdown by booking status (for example: Completed, Quoted, Cancelled, On Hold, Failed, Tentative, and others). This helps you understand conversion health and identify where leads are getting stuck.
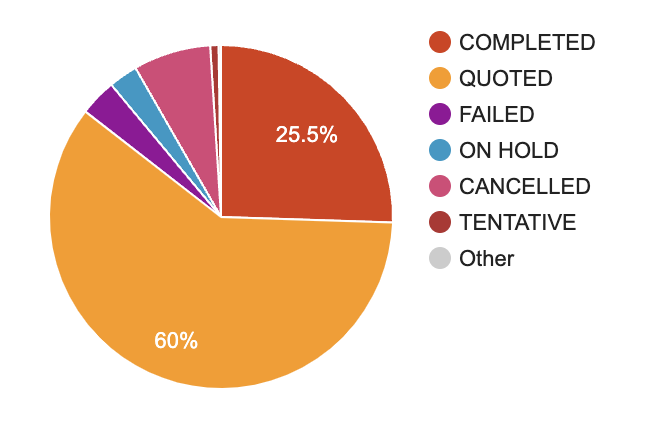
How to interpret booking status trends
- High “Quoted” volume: strengthen quote follow-up and reduce response time. Consider follow-up reminders and clearer quote options.
- High cancellations/failures: review lead qualification, availability, minimum charges, and service area rules.
- Many “On Hold” bookings: check internal approvals, pending customer actions, and capacity constraints.
Helpful conversion workflows:
Service accept/decline metrics
If your workflow includes dispatching work to fieldworkers/technicians (where they can accept or decline assigned services), the dashboard also provides service performance metrics such as:
- Total Service
- Total Service Accepted
- Total Service Declined
- Total Service Not Accepted Nor Declined (pending)
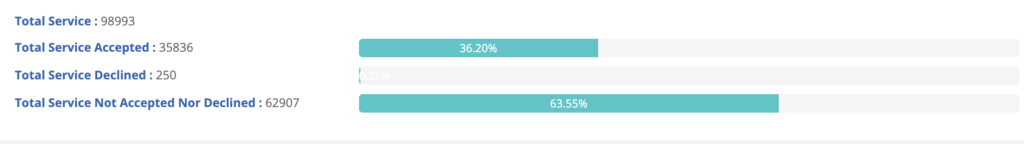
What this tells you
- Many pending services: could indicate slow responses, notification issues, or unclear job details.
- High decline rates: may suggest scheduling conflicts, coverage gaps, or mismatched job requirements.
- Low acceptance speed: consider tightening dispatch rules, improving job descriptions, and ensuring correct fieldworker availability settings.
Practical examples (how to act on the data)
- Optimize marketing spend: shift budget toward channels that produce higher-quality leads (not just more leads).
- Improve conversion: if inquiries rise but bookings don’t, review response time, quoting process, and follow-up cadence.
- Forecast demand: use weekly/monthly trends to plan staffing levels and availability.
- Reduce dispatch friction: if “pending acceptance” is high, improve notification settings and job request clarity.
Best practices
- Standardize lead source naming and keep the list tidy for accurate reporting.
- Review this dashboard weekly to catch bottlenecks early (e.g., quotes piling up or acceptance slowing).
- Use follow-up reminders to reduce “quoted but not converted” drop-off.
- Ensure correct timezone settings so your daily/weekly reporting aligns with your operations.
Troubleshooting
- Charts don’t match expectations: confirm your selected date range and Daily/Weekly/Monthly/Yearly view.
- Data looks shifted by a day: review your account timezone and time format settings: Date & Timezone Configuration.
- Lead sources are inconsistent or missing: clean up and standardize sources here: Track and Manage Lead Sources.
- Conversion seems low: review inquiry handling, quoting speed, and follow-up processes (see links below).
Related guides
- Managing Leads & Inquiries
- Adding Customer Inquiries
- Website Lead Capture Form
- Display Contact / Lead Capture Form
- View Inquiry Details
- Edit Inquiry Details
- Deleting Inquiries
- Convert Inquiry to Quote / Estimate
- Convert Inquiry to Booking
- Managing Follow-Up Reminders
- Live Reports & Analytics
To stay updated, please subscribe to our YouTube channel.